To Delete (a Vertebral Body from analysis), or Not to Delete, That is the Question
Submitted By: Lawrence Jankowski, CBDT Affiliation: Illinois Bone and Joint Institute, LLC. Morton Grove, Illinois.
USA Patient History:
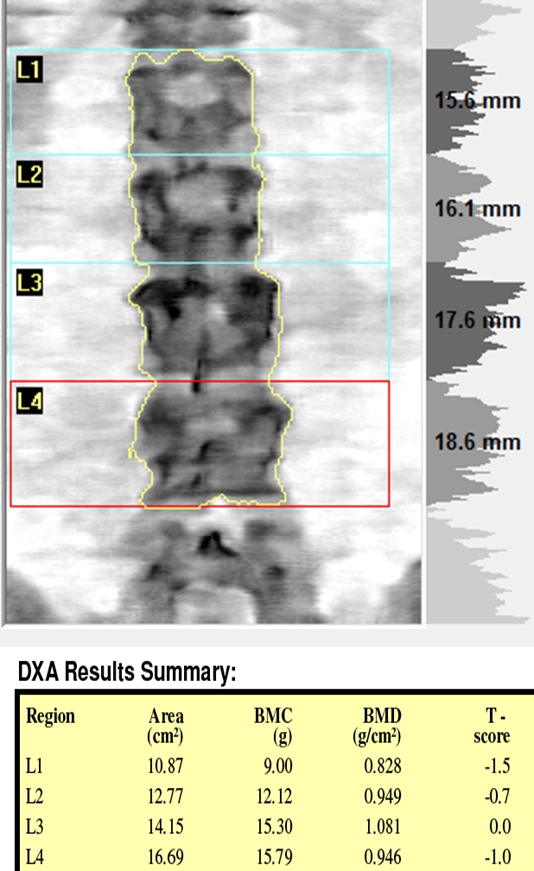
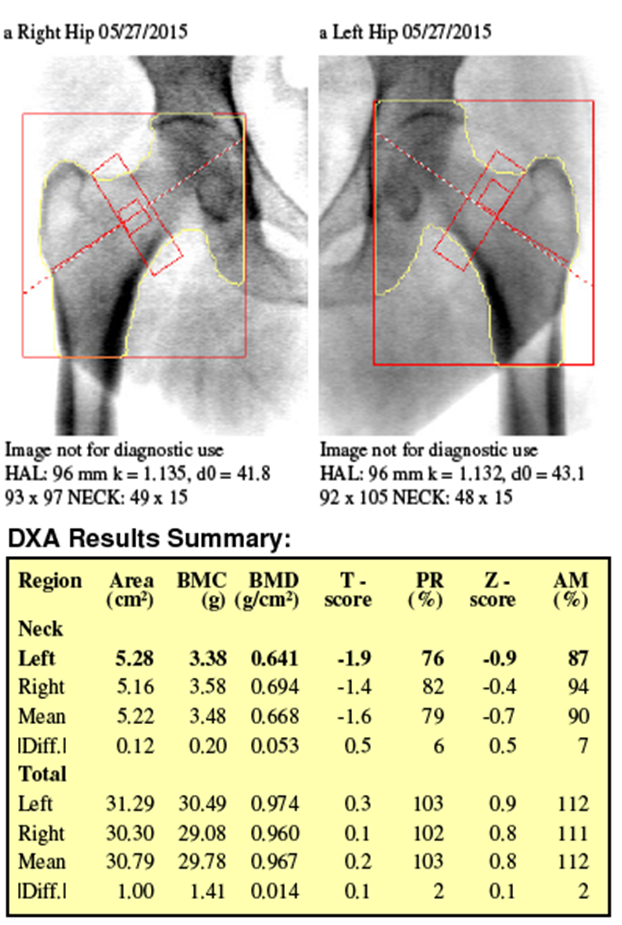
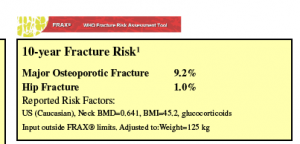
Morbidly obese (BMI 49.2, 134 kg) white female, age 53, three years post-menopause, on oral prednisone 5mg q.d. for undifferentiated mixed connective tissue disease. Chief complaints include chronic lower back pain, and severe bilateral osteoarthritis of the knees, with right knee more severe than left, and the development of an increasingly antalgic gait, is referred for a baseline DXA. No other FRAX related risk factors were identified. Spine, and bilateral hip DXA scans were acquired. Fat panniculus was retracted from the hip scans as per department protocol. Images of spine and hip scans are shown below in images 1 and 2 respectively. The FRAX 10-yr risk values are displayed in Image 3.
Image 1: DXA image and corresponding individual and total area, BMC, BMD, T-scores and Z-scores
Image 2: Bilateral femur scans and results. Note: Fat panniculus was retracted during both hip scans.
Image 3: Caption: FRAX 10-year major and hip fracture risks based on left femur neck BMD (lower of the two).
Questions:
- Are the scans properly acquired and analyzed?
- Should you be concerned with the discordance in BMD between left and right femur necks?
- FRAX Major osteoporosis fracture risk was 9.2%, and hip fracture risk was 0.9%, based on the lower femur neck BMD. Is this appropriate?
- What, if any, additional testing would you consider in this patient?
- Answers:
- The scans were deemed to be of sufficient technical quality as to positioning and analysis.
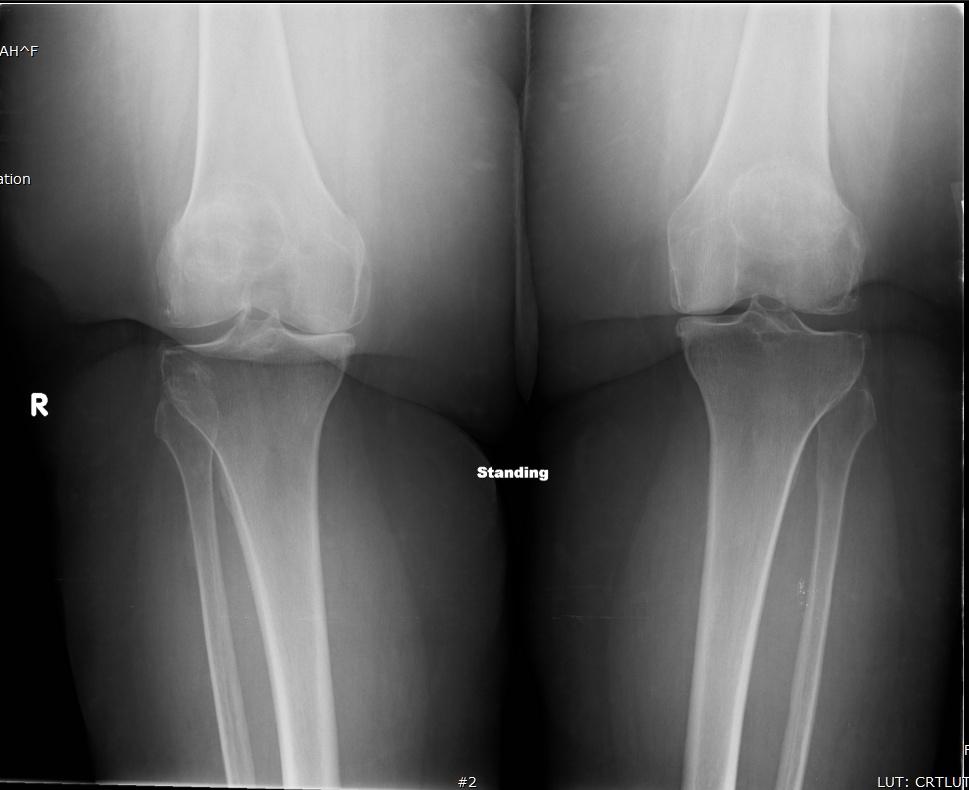
- Discordance in femur neck BMD has been demonstrated in observational studies of unilateral osteoarthritis of the knees (1), and given this patient’s body habitus, precision at the hip can be less than in normal weigh individuals. The discordance was not considered to be clinically significant. A prior radiograph of weight bearing bilateral knees is shown in supporting image 1 below.
- FRAX scores based on the left hip may not accurately reflect fracture risk in this patient. However, the values are still less than half of the current NOF treatment thresholds of 20% MOF, and 3% hip fracture risk. The inaccuracy is due to a limitation of the FRAX model in that the patient’s weight (138kg) and was adjusted to that of someone at the upper weight limit of 125 kg.
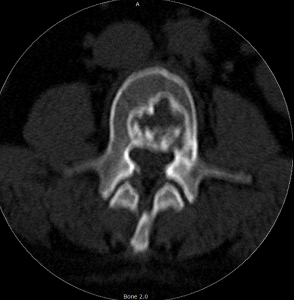
- While there are no numerical differences in T-scores greater than 1 SD and the height of L3 was not significantly different from the levels above and below, it was felt that the pattern of densities within the L3 vertebral level were atypical, and not consistent visually with the other levels. Due to the patient’s body habitus, and inability to tolerate MRI, a CT scan of the lumbar spine was ordered. An axial slice through the L3 vertebral body is shown in supporting image 2 below. The accompanying CT report impression was that this represented most likely, a benign osteoblastoma of the L3 vertebral body, with some extension into the right pedicle.
- Discussion
- While there is much emphasis placed upon the use of T-score differences of greater than 1 SD discordance to justify the exclusion of vertebral levels, especially in the elderly where osteoarthritis and calcified aorta artifactually increase density values, it is still important to inspect the DXA images, even in the absence of such discordance. The disclaimer “Image not for diagnostic use” means that, in this case, you cannot make a diagnosis of osteoblastoma. It doesn’t mean that you have license to ignore the images and to request higher order imaging when appropriate.
- Upon receipt of the CT report, the scan of the spine was re-analyzed to exclude the L3 vertebral level. While this did not result in any significant change in the resultant T-scores, it was felt appropriate in case the patient would return for a follow-up DXA so that the abnormal level would not be included in any rate of change calculations.
- The patient did return several years later for a repeat DXA, and the results of that scan is the basis of part two of this series on vertebral body exclusion.
Supporting Images
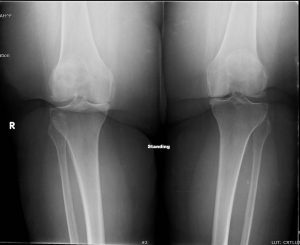
Supporting Image 1:Standing AP radiographs of the knees showing medial compartment joint space narrowing, more severe on the right, and consistent with the patient’s complain of knee pain, and her increasingly antagic gait.
Supporting Image 2 : Axial slice from CT scan through the middle of L3.
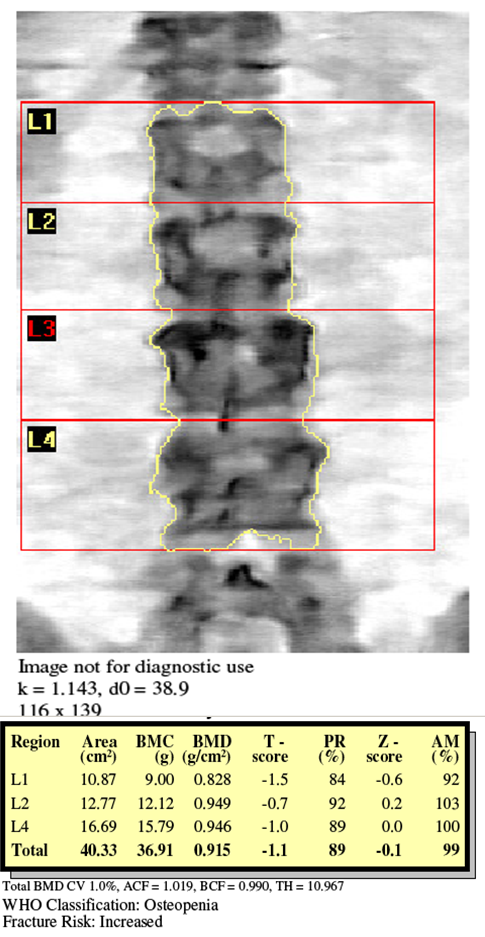
Supporting Image 3: Re-analysis of the spine scan with L3 excluded.
 Key Teaching Point: While DXA imaging is not of diagnostic quality, unexplained image presentations should not be ignored, and appropriate higher order imaging should always be considered.
References:
- Radiographic osteoarthritis of the hip and bone mineral density. The Study of Osteoporotic Fractures Research Group. Nevitt MC(1), Lane NE, Scott JC, Hochberg MC, Pressman AR, Genant HK, Cummings SR. Arthritis Rheum. 1995 Jul;38(7):907-1

