
Technical Issues with Image Quality, Case 14 |
|---|
 |
|
|
|
|---|
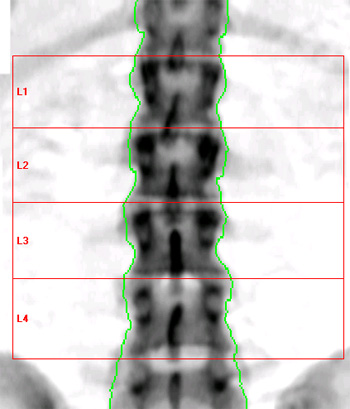
Comments: A T-score discrepancy exists between L3 and L4. However, all vertebrae appear normal on plain films and CT scan images, providing no explanation for the differential bone mass between L1-L3 and L4. T-scores were greater than two standard deviations above normal at all femur sites. The final DXA report described abnormally high L1-L3 bone mass and less marked elevation at L4. An evaluation for conditions causing high BMD may be appropriate. Similarly, causes of isolated low spine BMD at L4, such as hemangioma or lytic processes, should receive consideration. |
|---|
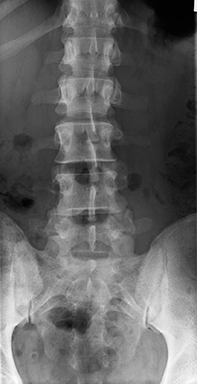
AP
|
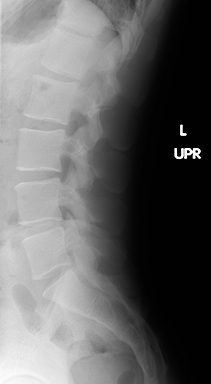
Lateral
|
|---|
Back to the previous Case |
To the next Case |